Global Tobacco Surveillance System
Data (GTSSData) - Help
|
|
Viewing and modifying table information
When you select options for displaying data, the system displays the
data in a table.
You can access a table by choosing to view data by location or view data by indicator.
View data by location:
When viewing data by location, the system allows you to select a location/survey site and then displays all the data collected for the selected location/survey site. You can select a location in the following three ways:
- Select a location from the map and drill down to the desired survey site.
- Select a WHO region and a survey site from the dropdown list and click GO.
- Click the View A-Z country list to view a list of countries, and then select the desired country.
Note: To run a more detailed search and further narrow down results, click
the Advanced Search link at the top of the page.
The system displays the populations (surveys) in tabs across the page.
Click on a tab to view the specific population (survey). To sort data
by a specific column.
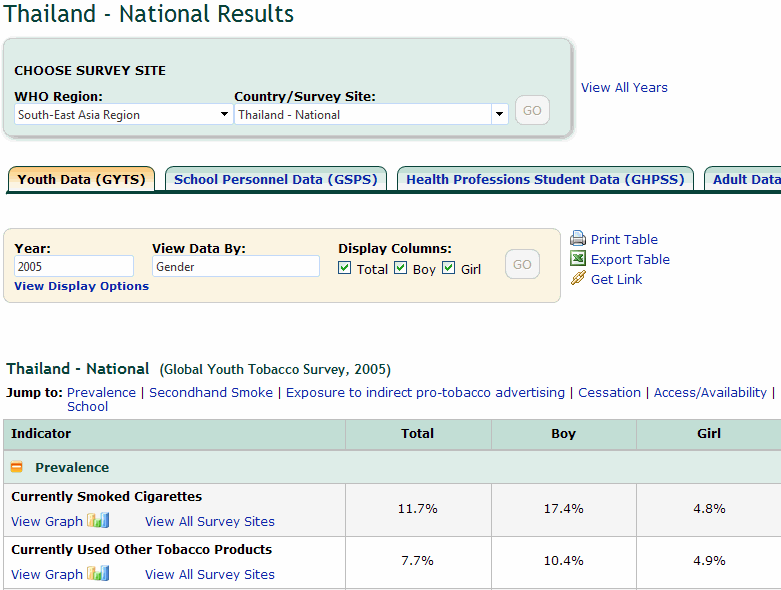
On this page you can:
Back to
top
Select and view another survey for the selected survey site and year
To change the data that is displayed on the page, select another WHO Region and country or survey site from the dropdown lists in the Choose Survey Site section and click GO. The system displays the data on the page based on the selected criteria.
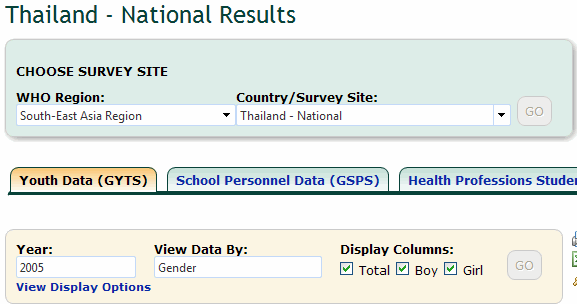
Viewing data for one year:
To view table content for one year:
- Select the WHO region from the WHO Region dropdown list. The system
populates the Country/Survey Site dropdown list with the sites for the
selected region.
- Select the country or survey site from the Country/Survey Site dropdown
list.
- Select the desired year from the Year dropdown list, if available.
- Click GO. The system displays the data for the selected
year.
Back to
top
Viewing data for all years:
- Select the WHO region from the WHO Region dropdown list. The system
populates the Country/Survey Site dropdown list with the sites for the
selected region.
- Select the country or survey site from the Country/Survey Site dropdown
list.
- Select All Years from the Year dropdown list.
Note: You can also select the View All Years link to view all years.
- Click GO. The system displays information for all
years for the selected location.
Back to
top
Modifying content
to display in a table
Filtering
data using Display check boxes
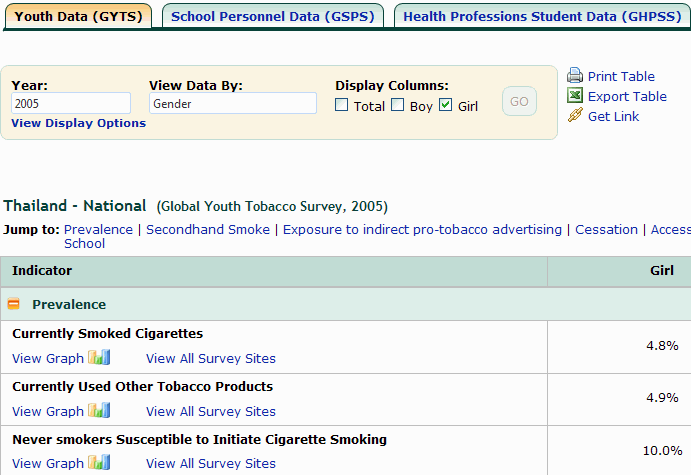
You can use the Display check boxes to filter the number of columns to
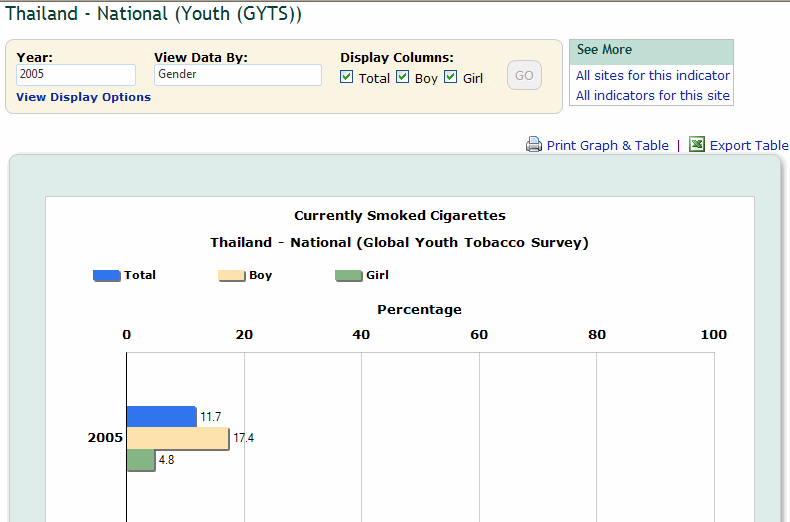
display for an indicator. In the screenshot below, the system is displaying data for Total, Boy, and Girl.

- Select the region, survey site, year, and option(s) to view data by.
- In the DisplayColumns section, check or
uncheck the columns to display. For example, in the screenshot displayed
above, the Total, Boy, and Girl columns are displayed because the three
check boxes are selected. For example, to display only totals, uncheck the Boy and
Girl check boxes.
- Click GO. The system displays the data based on the
selected options. In the screenshot below, the system is displaying the data for only girls.
Back to
top
Changing display
options
You can choose display options using the Table Display Options located
above the table. The Hide Display Options/Show Display Options link toggles
between hiding and showing the options.

Selecting display options:
- Click the Show Display Options link (if display options
are hidden).
- In the Display confidence Intervals field, click Yes to display the Confidence Intervals for the data and No to hide the Confidence Intervals.
- In the Display Sample Size field, click Yes to display
the sample size for the data and No to hide the sample
size.
- Click GO. The system displays the table according to the
selected options.
Back to
top
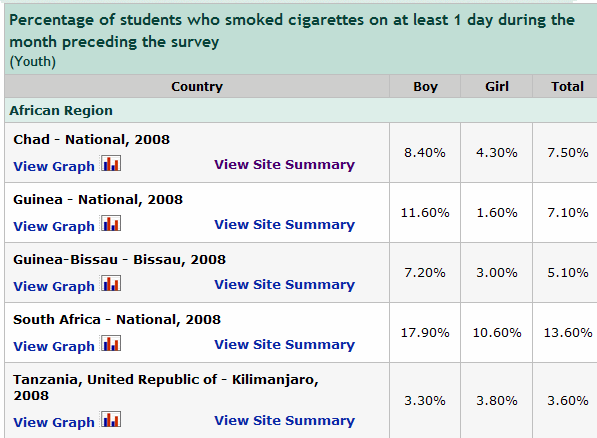
Viewing site summary
You can view summary information for the site being currently viewed.
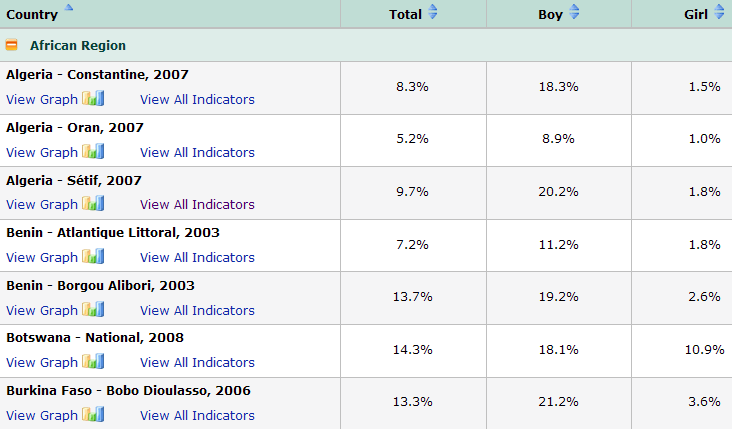
Site summary information consists of the country-survey site, indicator, topic or MPOWER objective, year, and data values.
To view site summary:
- Click the View All Survey Sites link next to the desired indicator. The system displays
the site summary information for the country/survey site and indicator selected, and displays the View All Indicators link which you can click to return to the original
view. The system toggles these two links.
- Click the View All Indicators link to return
to the original view.
Back to
top
View data by indicator:
When viewing data by indicator, the system allows you to select a survey and topic (or MPOWER) and displays the data collected for all the indicators associated with the selected survey and topic. You can select to view data by indicator in the following two ways:
- On the GTSS home page, select the survey, select the topic or MPOWER option, and select an indicator. Or,
- Click the View all indicators by topic link. The system displays the Choose an Indicator page.
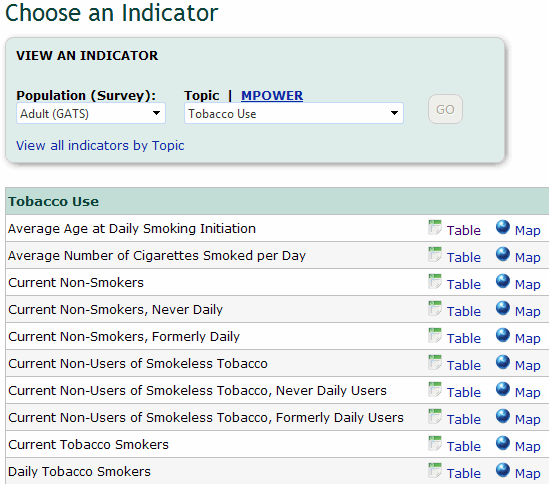
- Locate the desired indicator and click on the format for viewing the data, Table or Map. If you select Table, the system displays the data in table format. If you select Map, the system displays data in an interactive map,
which consists of a data table, world map, bar chart, and legend.
Note: To run a more detailed search and further narrow down results, click
the Advanced Search link at the top of the page.
Back to
top
Viewing and Modifying indicator data in table format
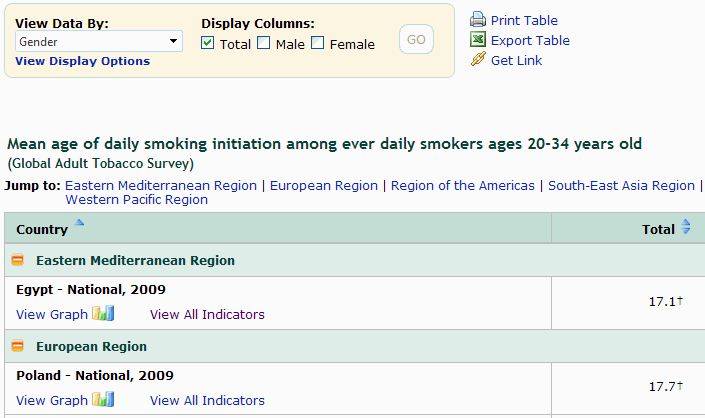
When you choose to view indicator data in table format, the system displays the table below.
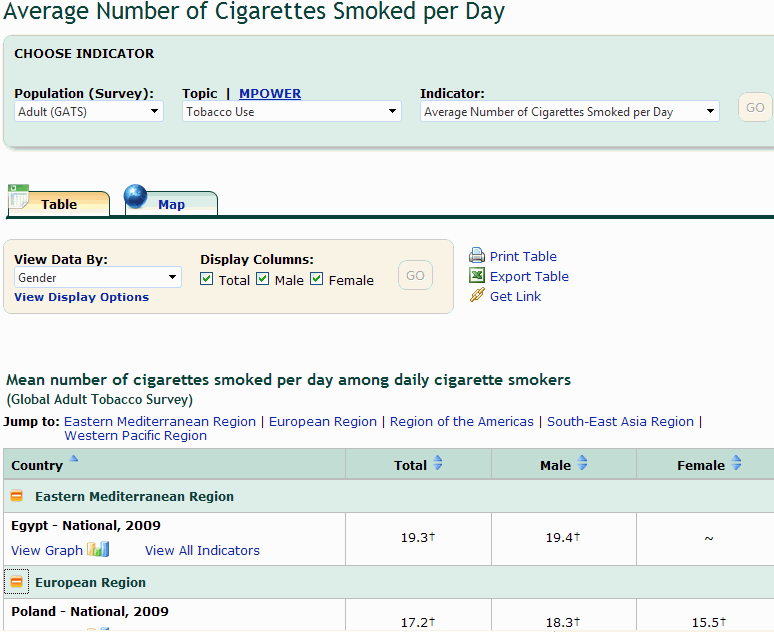
On this page you can:
Back to
top
Select and view another population/survey and topic
To change the data that is displayed on the page, select another population or survey, topic (or MPOWER), indicator, and click GO. The system displays the data on the page based on the selected criteria.
Back to
top
Modifying content
to display in a table
Filtering
data using Display check boxes
You can use the Display Columns check boxes to filter the number of columns to
display for an indicator.
To filter the data displayed:
- Select the survey site, topic (or MPOWER), indicator and click GO.
- In the Display Columns section, check or
uncheck the columns to display. For example, in the screenshot displayed
above, the Total, Male, and Female columns are displayed because the three
check boxes are selected. For example, to display only totals, uncheck the Male and
Female check boxes.

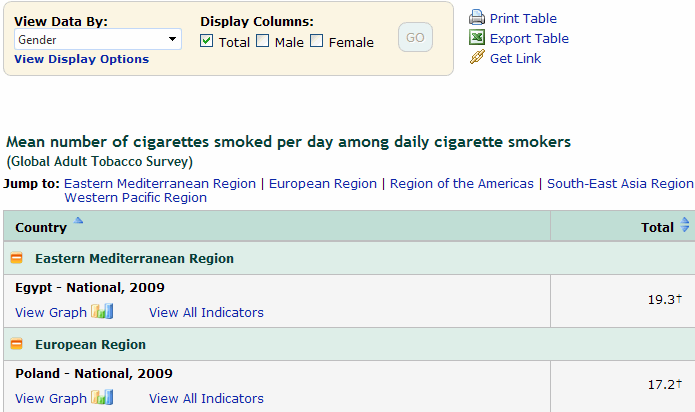
- Click GO. The system displays the data based on the
selected options. In the screenshot below, the system is displaying only Total data.
Back to
top
Selecting display
options
You can choose additional display options using the Table Display Options section located
above the table. The Hide Display Options/Show Display Options link toggles
between hiding and showing the options.

To change display options:
- Click the Show Display Options link (if display options
are hidden).
- In the Display confidence Intervals field, click Yes to display the Confidence Intervals for the data and No to hide the Confidence Intervals.
- In the Display Sample Size field, click Yes to display
the sample size for the data and No to hide the sample
size.
- Click GO. The system displays the table according to the
selected options.
Back to
top
Viewing data for all indicators
You can view data collected for all indicators for a particular country or survey site.
To view all indicators for a country or survey site:
- Click the View All Indicators link for the country or survey site. The system displays all the data collected for the selected survey site and also displays the View All Survey Sites link which you can click to return to the original
view. The system toggles these two links.
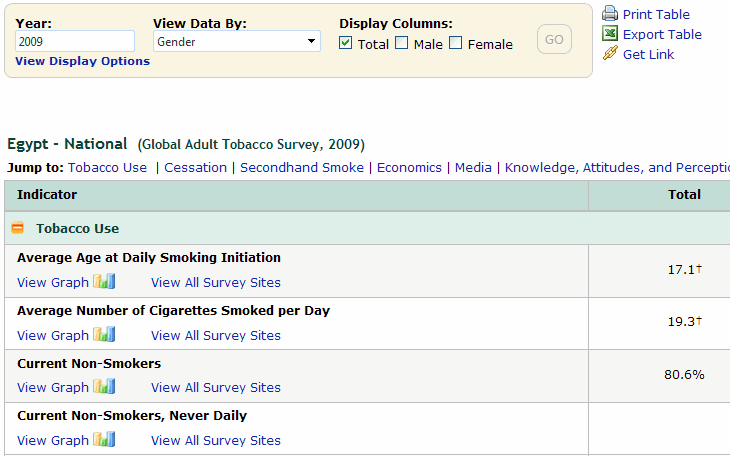
- Click the View All Survey Sites link to return
to the original view.
Back to
top
Collapse and expand regions
By default, the list is expanded for each WHO region. To collapse a section and thereby shorten the list, click the  graphic next to the WHO region name. To expand the section again, click the graphic next to the WHO region name. To expand the section again, click the  graphic next to the region name. To expand or collapse all the WHO regions, click the Expand all Regions or Collapse all Regions links to the left side of the table. graphic next to the region name. To expand or collapse all the WHO regions, click the Expand all Regions or Collapse all Regions links to the left side of the table.
Back to
top
Sort the table by a particular column
To sort the table according to a particular column on the table, click on the column heading. The following arrows  next to a column heading allow you sort the column in descending or ascending order. next to a column heading allow you sort the column in descending or ascending order.
Back to
top
View the displayed data in graph format
To view the displayed data for each country under a WHO region in graph format, click the View Graph link or  graphic under the country name. The system displays the data for the most recent year for the selected country in graph format. To change the data displayed in the graph, select a different year (if multiple years are available) and select a different option in the View Data By drop down list. You can also choose the number of columns displayed in the graph by checking or unchecking the check boxes under the Display Columns section. After changing a selection, you must click GO, in order for the system to update the graph based on the new selections. graphic under the country name. The system displays the data for the most recent year for the selected country in graph format. To change the data displayed in the graph, select a different year (if multiple years are available) and select a different option in the View Data By drop down list. You can also choose the number of columns displayed in the graph by checking or unchecking the check boxes under the Display Columns section. After changing a selection, you must click GO, in order for the system to update the graph based on the new selections.
Back to
top
Jump to a specific region
To jump to a particular region and view the data, click on the region name at the top of the data table.

Back to
top
Related
indicators
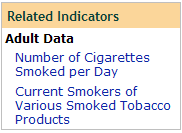
The Related Indicators section at the top right of a table displays the
indicators that are related to the indicator currently being viewed. To
view a related indicator, click on the link for the indicator.
Back to
top
Footnotes
The Footnotes section at the bottom of the page provides more information
for the content displayed on the page. The Footnotes section explains
the symbols displayed in a table.

Back to
top
Printing a table
To print a table:
- While viewing the table you want to print, click the Print
Table link.
- Use the standard Print dialog box to complete the printing process.
Back to
top
Exporting table
information to Excel
To export table information:
- While viewing the table, click the Export Table
link.
- Use the standard Save dialog box to complete the export process.
Back to
top
Getting the link for a table
or graph
To get the link for a table or graph:
- While viewing the table or graph, click the
 Get
Link link. The system displays a pop-up window with the link. Get
Link link. The system displays a pop-up window with the link.

- Copy the highlighted link and paste into the desired location.
Back to
top
View data in graph format
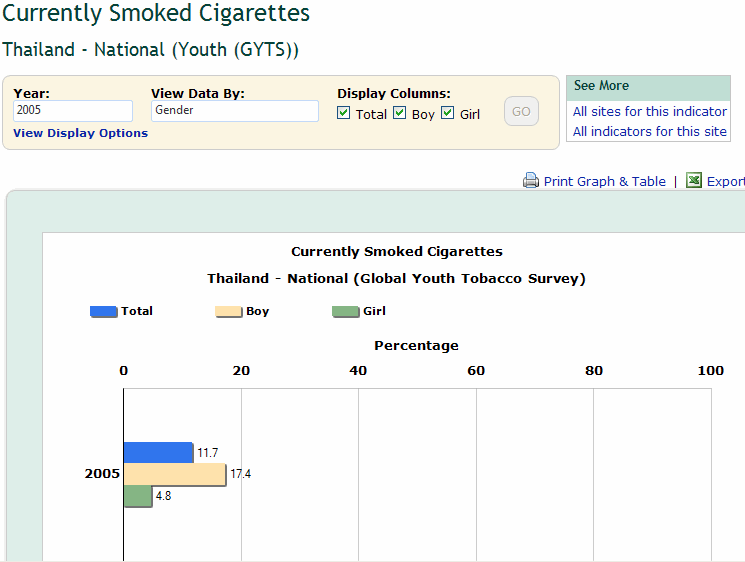
Information presented in a table is also depicted in a graph. To view
a graph, click on the Graph icon ( )
next to the data that you want to view in a graph. The system displays
a graphical representation for the indicator. The indicator is displayed
at the top of the graph and a table showing the data in the graph is also
displayed below the graph. Just as in a table, you can use the options
available in the section above the graph to determine the data displayed
in the graph. After changing a selection, you must click GO, in order for the system to update the graph based on the new selections. )
next to the data that you want to view in a graph. The system displays
a graphical representation for the indicator. The indicator is displayed
at the top of the graph and a table showing the data in the graph is also
displayed below the graph. Just as in a table, you can use the options
available in the section above the graph to determine the data displayed
in the graph. After changing a selection, you must click GO, in order for the system to update the graph based on the new selections.
Back to
top
Printing graphs
To print a graph:
- While viewing the graph(s) you want to print, click the Print
Graph link. The system displays a windows dialog box
for selecting printing options.
- Select the desired printing options and print the graph.
Back to
top
See more
When viewing a graph, you can use the See More section to view more information
for the indicator and site being viewed. Click the All sites for
this indicator link to view all the sites that are available
for the indicator being viewed or click the All indicators for
this site link to view all the indicators that are available
for the survey site being currently viewed.

Back to
top
|
