|
||||
|
||||
|
|
HEALTHY YOUTH: YOUTH ONLINE |
Viewing and modifying table information
Introduction
When you select options for displaying data, the system displays the
data in a table. To sort data by a specific column, click the following
graphic ![]() next to the specific column heading.
next to the specific column heading.
You can access a table by doing one of the following:
- On the Youth Online home page, select a survey, High School YRBS, Middle School YRBS, or GSHS and select a location.
- On the Youth Online home page, select a health topic and select a question from the Questions page.
You can choose to view data in table or graph format.
Selecting a question(s), location(s), and year(s)
- Selecting table content for one location
- Viewing two locations and/or two years
- View all locations for one year and one question
- Viewing two years
- Viewing all questions
- Viewing all years
- Viewing one question for all locations
- Viewing all questions for one location
Modifying content to display in a table
- Changing column by-variable
- Stratifying a table further
- Managing display options
- Viewing differences between two data points using T-tests
- Viewing response details
- Filtering data
- The Slider
- Footnotes
- Printing a table
Selecting a question(s), location(s), and year(s)
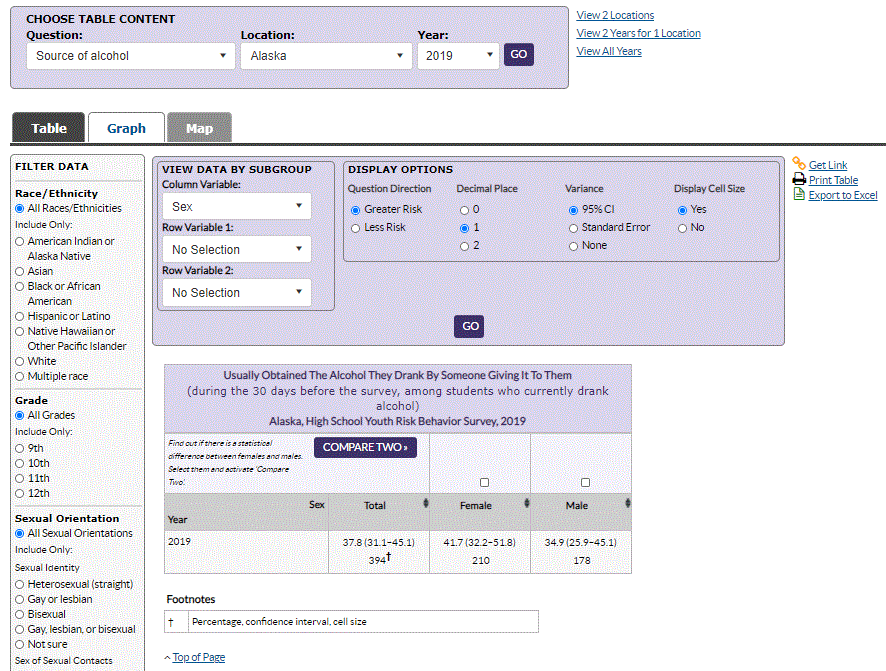
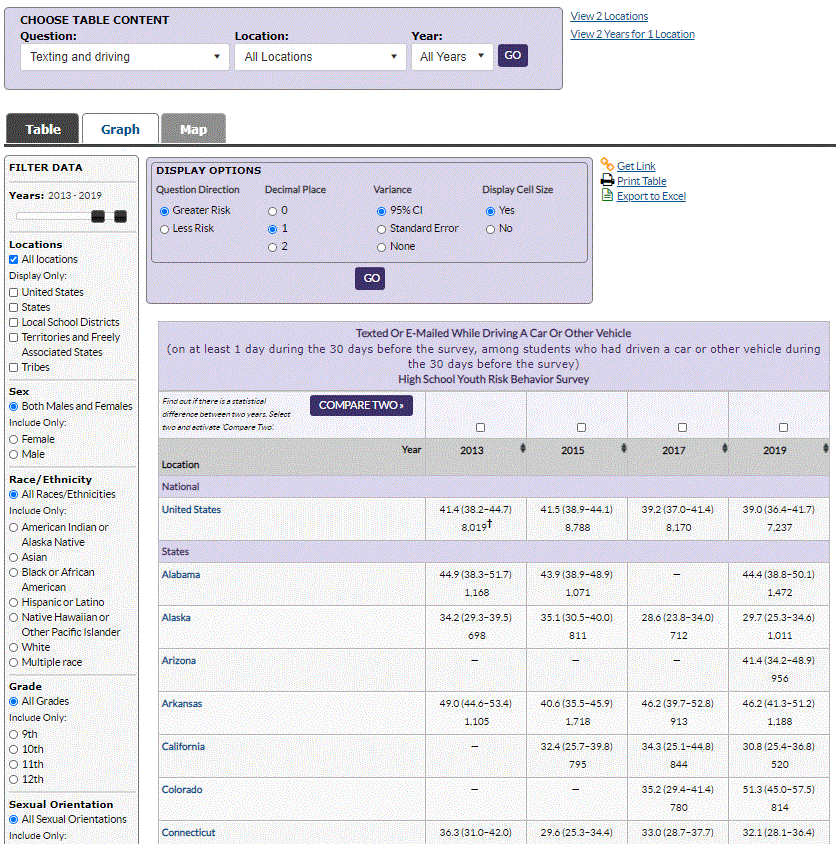
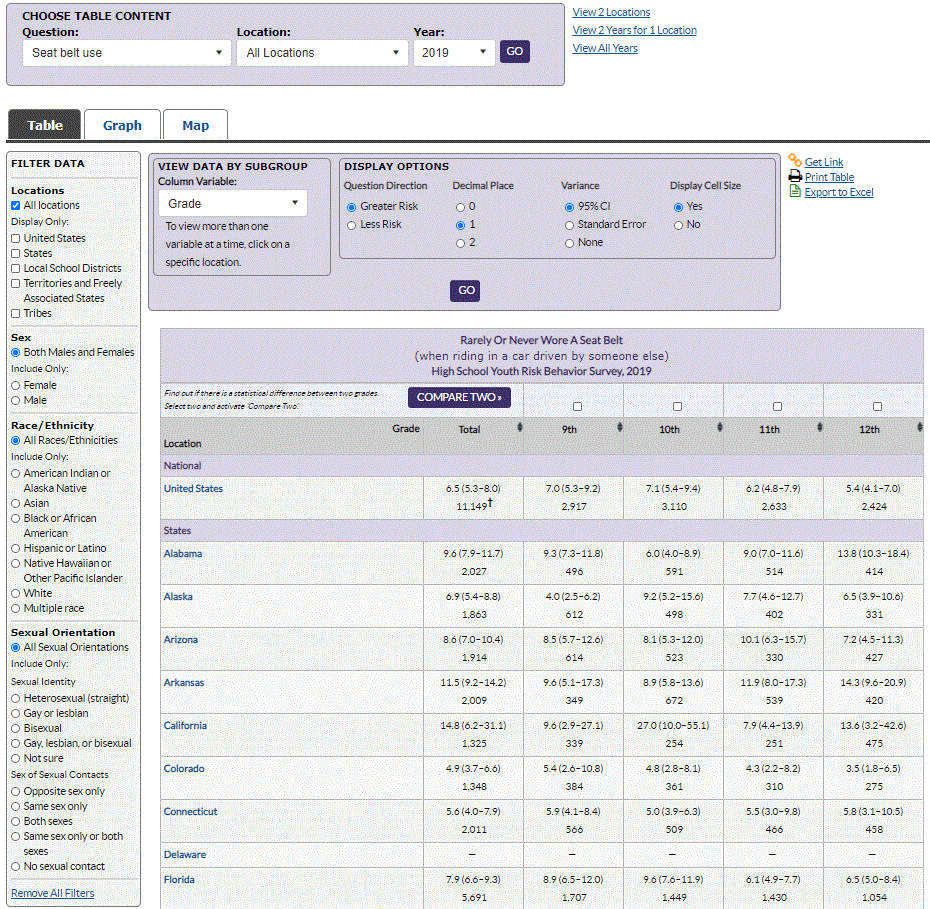
Use the Choose Table Content section at the top of the page to select the question (one or all), location(s), or year(s) for which to display responses. You can use this section to do the following in several different combinations:
- Select table content for one location
- View two locations
- View all locations for one year and one question
- View two years
- View all questions
- View all years
Selecting Table Content
To select table content for one location:
- To select a question, do one of the following:
- To view responses for all questions, select All Questions.
- To view responses for a specific question, click the Question
dropdown list. The system expands the list to show the question
categories.
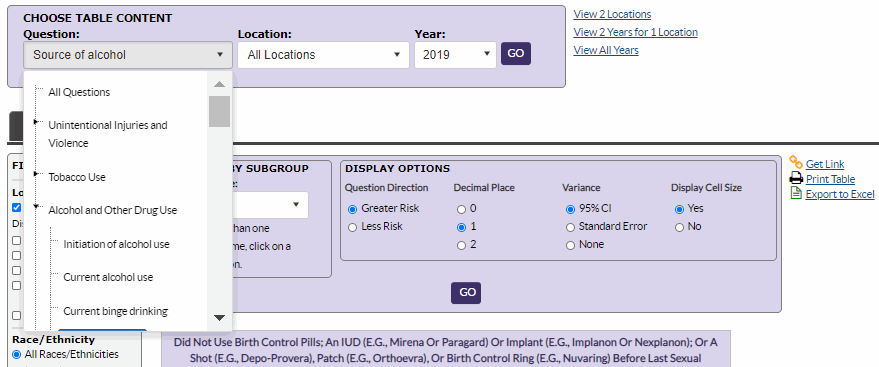
- Click the arrow next to the desired category, for example, Hygiene. The system displays the questions for the
category.
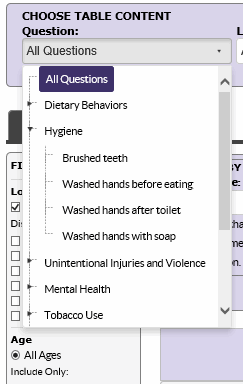
- Select the desired question, for example, Brushed Teeth.
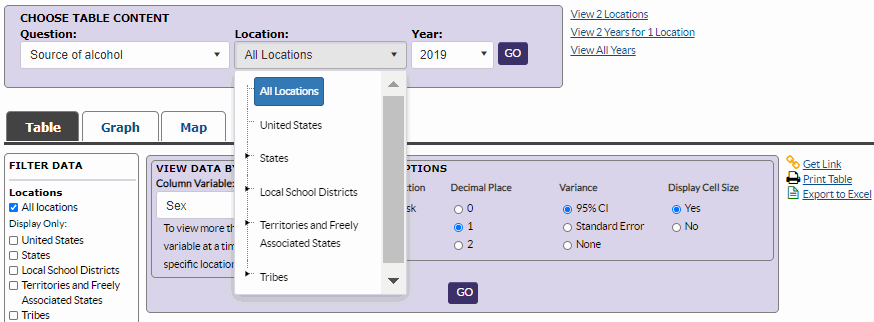
- Select a location from the Location dropdown list, for example South-East Asia region, and then select the specific location, e.g. India.
- Select a year from the Year dropdown list.
- Click GO. The system displays information in the
table based on the options selected in the Choose Table Content section.
Notes:
The system auto-populates the Year field with the latest year for which data is available for the selected state. When viewing just one question by one location, you can also choose to view all years (in rows).
The Map tab is disabled and available only when viewing All Locations for one question and one year.
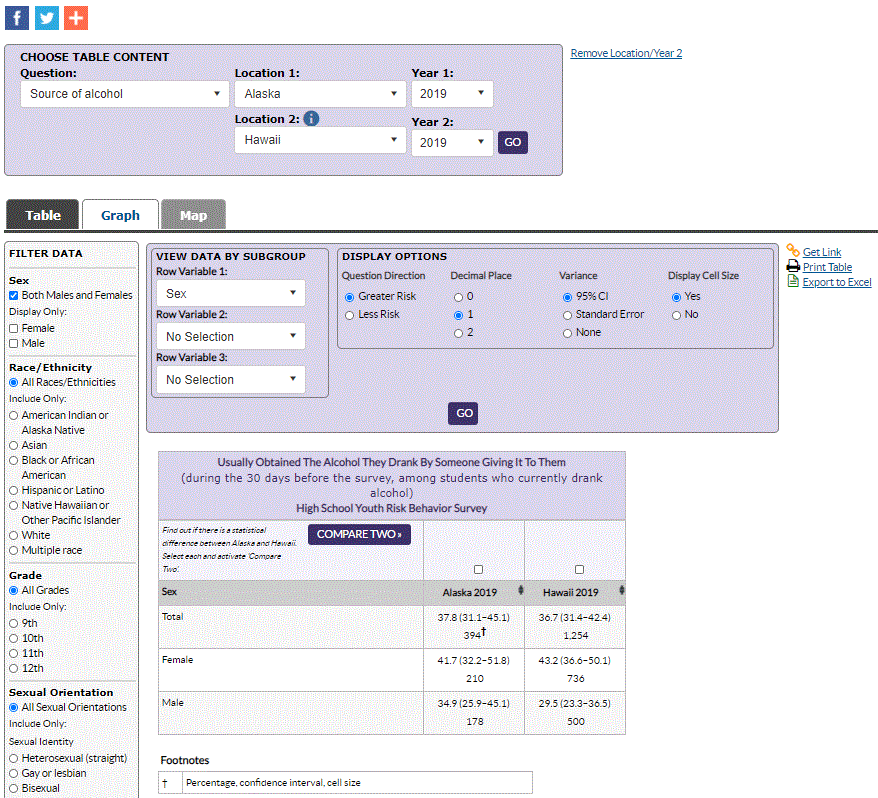
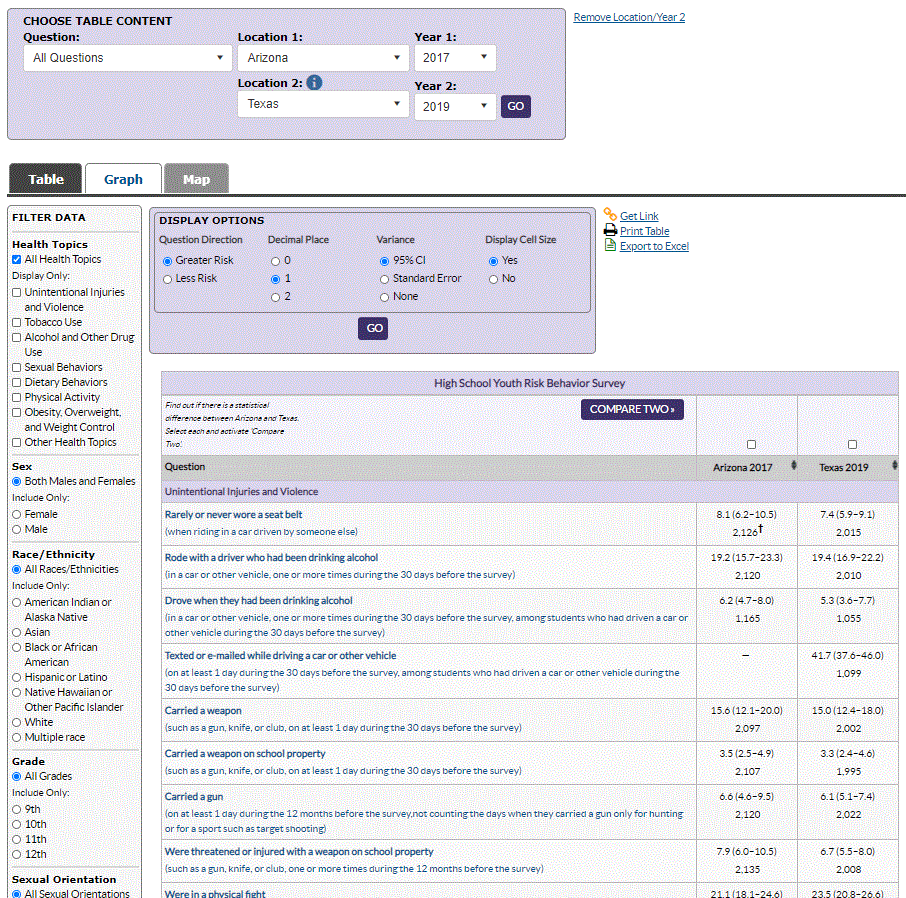
Viewing two locations and/or two years:
- Click the View two locations link on the right hand
side of the Choose Table Content section. The system displays the fields for viewing
2 Locations and 2 Years.
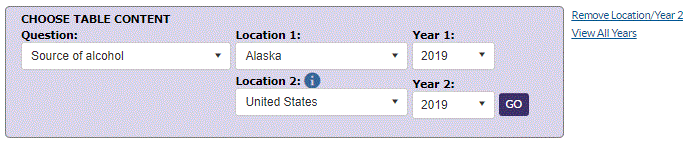
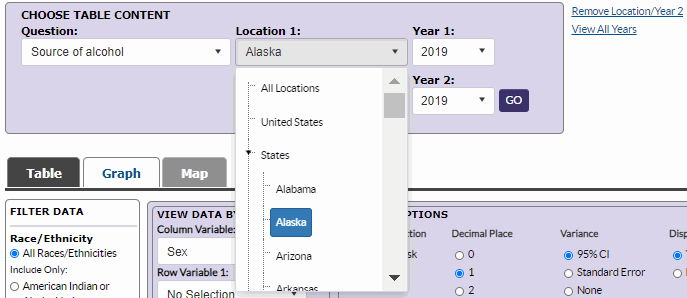
- Select a location from the Location 1 dropdown list.
Note: To select a location, click on the desired Location dropdown list and select either All Locations, or click on a specific category, for example States, to select from the category.
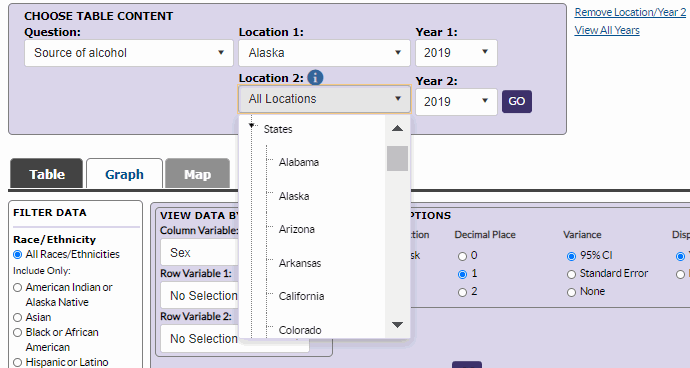
- Select a location from the Location 2 dropdown list.
Note: To view two years for the same location, select the same location in Location 1 and Location 2 dropdown lists.
- Select a year from the Year 1 dropdown list and a year from the Year
2 dropdown list.
- Click GO. The system displays information on the
page based on the options selected.
Note: To remove a previously selected location, click the Remove Location/Year 2 link.
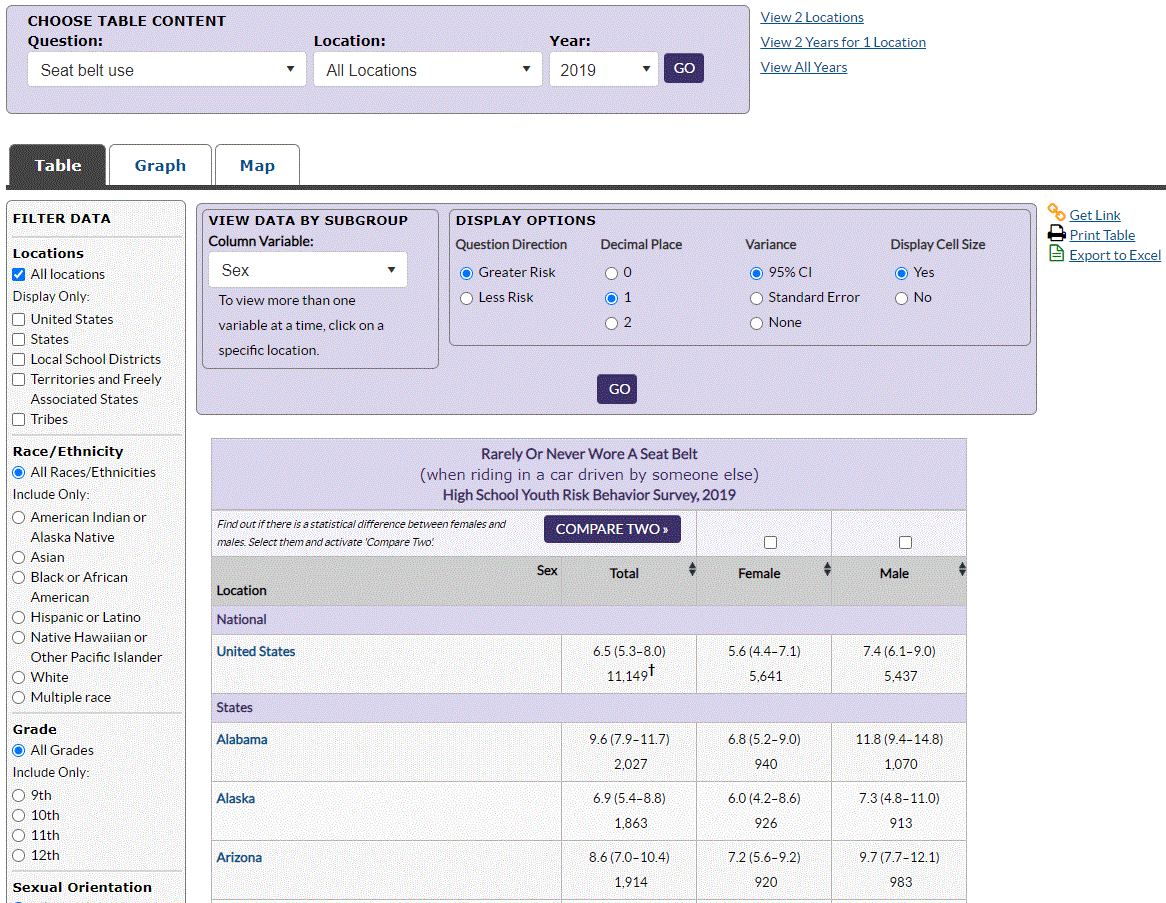
Viewing all locations for one year and one question:
- In the Question drop down, select the desired question.
- In the Location drop down, select All Locations.
- In the Year drop down, select the desired year.
- Click GO. Note that the system displays the data in Table, Graph, and Map formats. The Map tab is available only if you select one question, all locations, and one year.
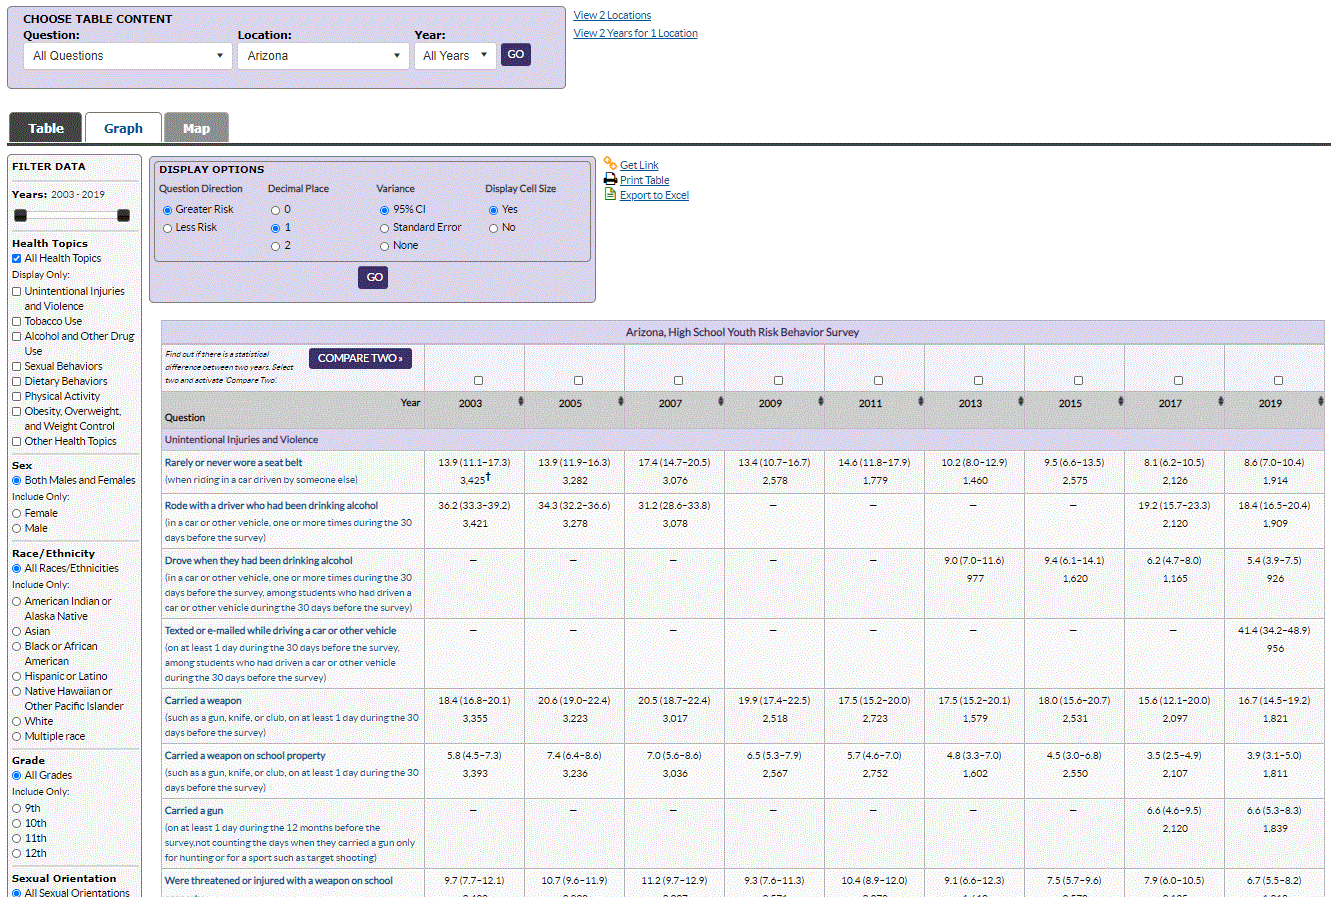
Viewing all questions for one location:
- Select All Questions from the Question dropdown list.
- Select a location from the Location dropdown list.
- Select a year from the Year dropdown list or select All Years.
- Click GO. The system displays information on the
page based on the options selected.
Note: All questions are displayed under the Question column. Each category has the associated questions displayed under it.
Viewing all questions for two locations:
- Select All Questions from the Question dropdown list.
- Click the View two locations link on the right hand
side of the Choose Table Content section.
- Select a location from the Location 1 dropdown list.
- Select a year from the Year 1 dropdown list.
- Select a location the Location 2 dropdown list.
- Select a year from the Year 2 dropdown list.
- Click GO. The system displays information on the
page based on the options selected.
Note: All questions are displayed under the Question column. Each category has the associated questions displayed under it.
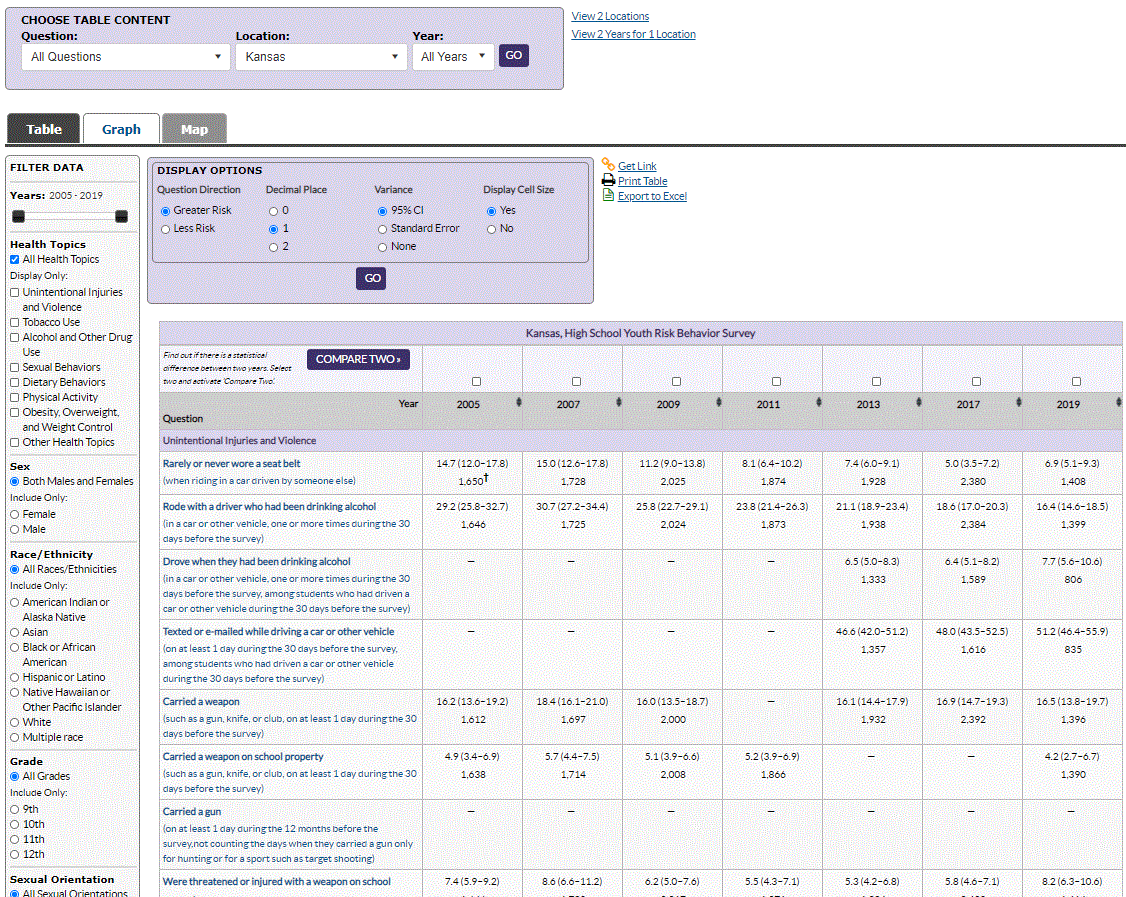
Viewing all years, all questions for one location
Note: After viewing two locations, you can click the Remove Location/Year 2 link to remove the Location 2 and Year 2 options.
- Select all questions from the Question dropdown list.
- Select All Years in the Years dropdown list or click the View
All Years link.
- Click GO. For the available years, the system displays the questions for the selected location.
Viewing all years, one question, for all locations:
- Select one question from the Question dropdown list.
- Select All Locations in the Locations dropdown list.
- Select All Years in the Years dropdown list.
- Click GO. The system displays data for all the available years and all locations.
Modifying content to display in a table
- Changing column by-variable
- Viewing one question for all locations
- Viewing all questions for one location
- Stratifying a table further
- Managing display options
- Viewing differences between two data points using T-tests
- Viewing response details
- Filtering data
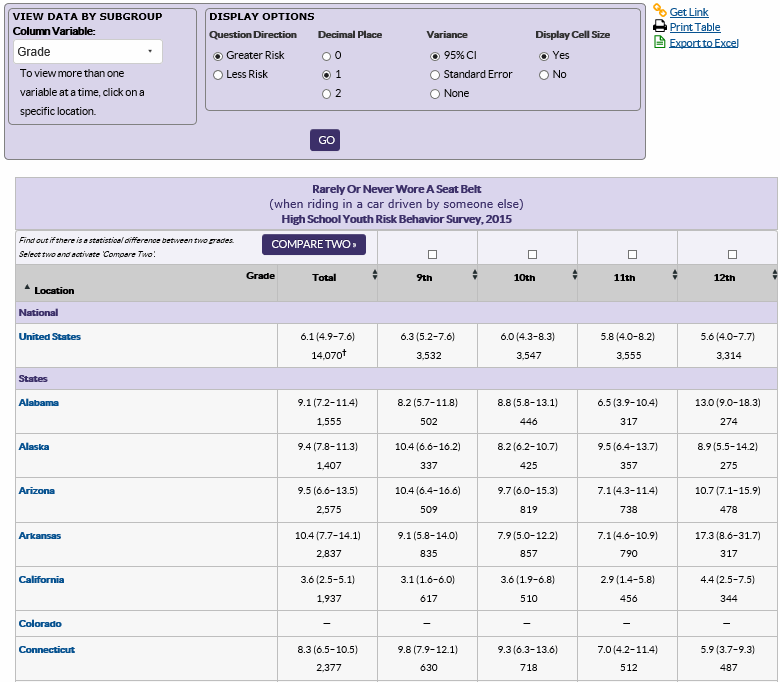
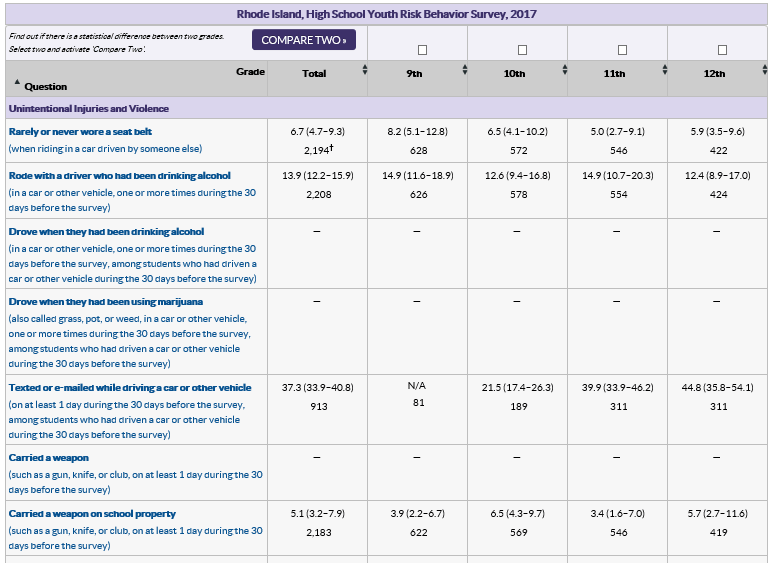
You can choose to display a table using the following column variables:
- Sex (default)
- Grade
- Race/Ethnicity
- Totals only
- Sexual Orientation (Sexual Identity, Sex of Sexual Contacts)
Note: When viewing one question for all locations you can stratify the information displayed by only one column. If you want to further stratify the information displayed by choosing additional row variables, then you must select only one question and one location.
- Under the Choose Table Content section, select the desired question
from the Question dropdown list.
- In the Location dropdown list, select All Locations.
- In the Year dropdown list, select the desired year and click GO.
The system displays the table based on the options selected.
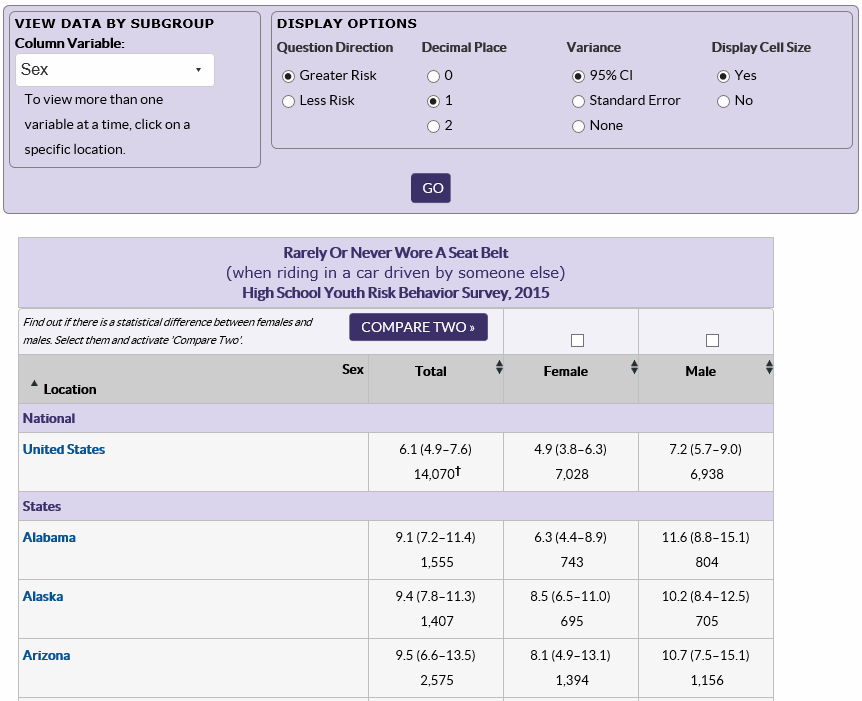
- Under the View Data by Subgroup section, select the column variable
to use for stratifying the information displayed, for example, Grade
and click GO. The system displays
the information according to the selected column variable.
- After displaying the desired columns, you can proceed to do the following.
When viewing one question for one location, you can further stratify the information displayed by choosing additional row variables. After selecting a question/location
- Under the Choose Table Content section, select the desired question
from the Question dropdown list.
- In the Location dropdown list, select the desired location.
- In the Year dropdown list, select the desired year and click GO.
The system displays the table based on the options selected.
- Under the View Data by Subgroup section, select the desired variable,
for example, Sex from the Column Variable dropdown list and click GO.
The system displays options for selecting row variables.
- Select a row variable, for example, Grade from the Row Variable 1
dropdown list. You may click GO or proceed to step
3 and select another row variable.
- If desired, select a row variable for example, Race from the Row Variable
2 dropdown list and click GO. The system displays the
table based on the variable selected.
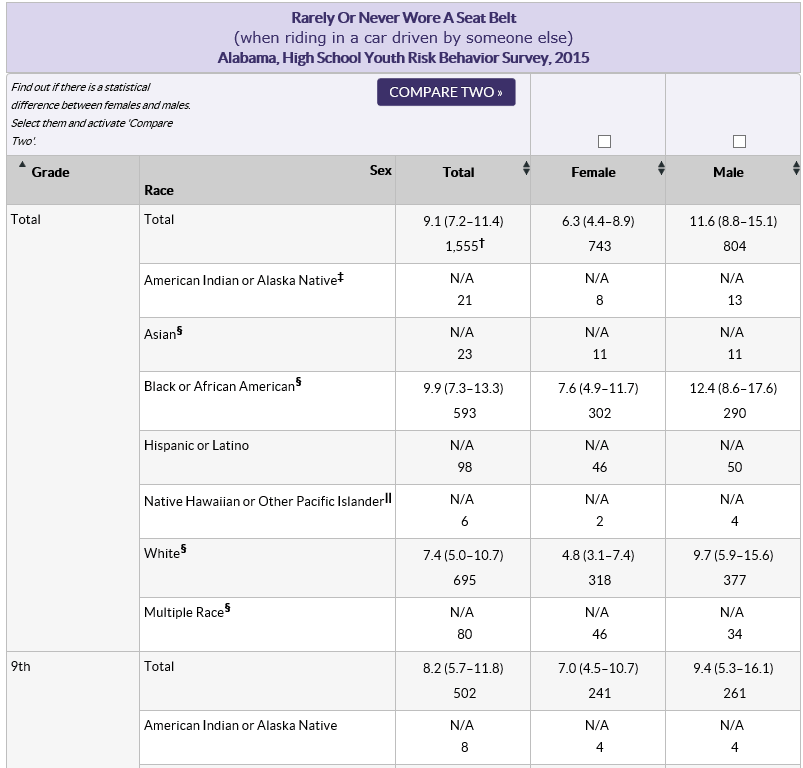
- After displaying the desired columns, you can proceed to do the following.
You can choose to display options using the Display Options located above the table.
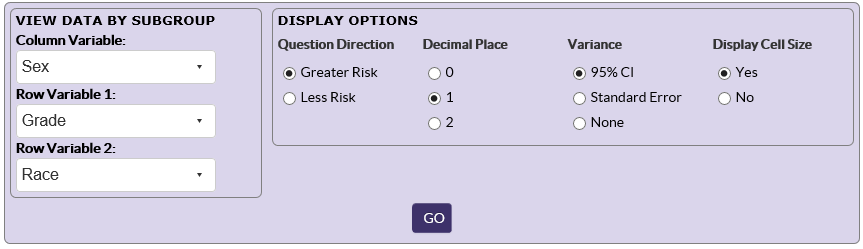
Selecting display options:
- In the Decimal Place field, select the decimal place to use for numbers.
For example, the number 34.75 will be displayed as:
- 34 if you select 0
- 34.7 if you select 1
- 34.75 if you select 2
- In the Variance field, select a variance to be displayed. The options
are as follows:
- 95% Confidence Intervals
- Standard Error
- None
- in the Display Cell Size field, select yes if you want the system
to display the cell size or No if you want the information hidden.
- In the Question Direction field, indicate by selecting Greater Risk if you want data displayed by greater risk or select Less Risk if you
want data displayed by less risk. The system displays the data based
on the options selected.
- Click GO.
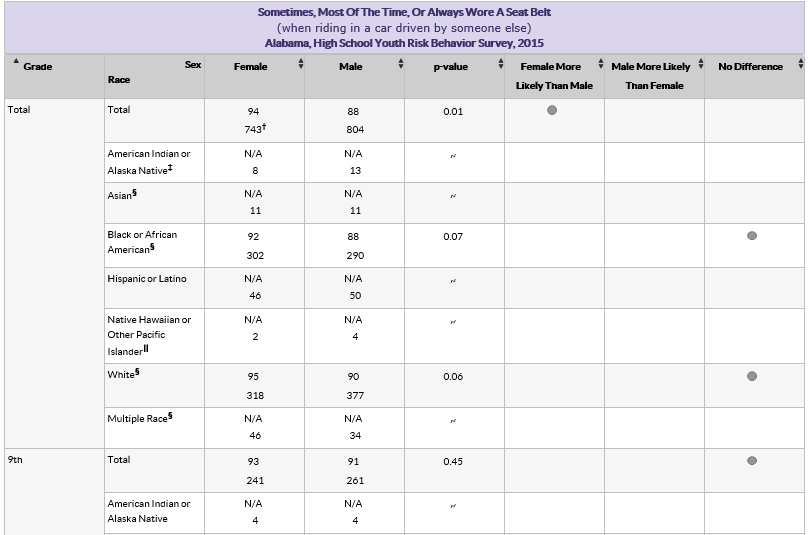
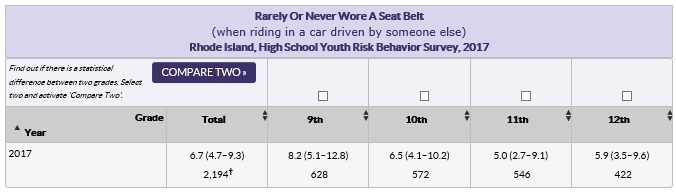
Viewing differences between two data points using T-tests
After choosing the column and variable rows to display as described in Changing column by-variable, you can proceed to compare any two variables on a table.
To compare column variables:
- Select the two variables to compare by selecting the checkboxes at
the top of each variable.
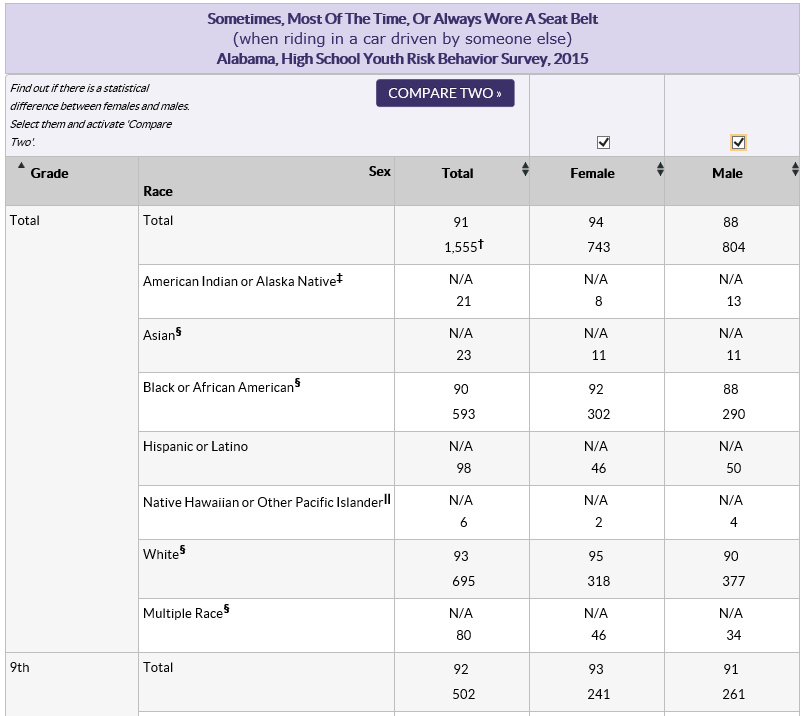
- Click the Compare Two button. The system displays
comparison data for the two variables being compared and uses gray dots
to depict comparison information.
Note: The system displays dots under the columns to indicate the results T-test. You can choose to display the p-value by selecting Yes in the Show p-value field.
When stratified by either Sexual Identity or Sex of Sexual Contacts, “Gay or lesbian” cannot be compared to “Gay, lesbian or bisexual” and “Bisexual” cannot be compared to “Gay, lesbian or bisexual”.
- After comparing the variables, you can proceed to do the following:
- Manage display options.
- Return to the data table by clicking the Return to data table link and run another comparison.
- Filter the data displayed.
- Print the table.
You can select a question and view the response details for the question.
To view a question:
- Click on the desired question. The system displays the responses for
the question.
- Click on the desired response. The system displays the response details.
- After viewing response details, you can proceed to do the following:
- Modify the table and view the details for another response.
- Manage display options.
- View differences between two data points using T-tests.
- Filter the data displayed.
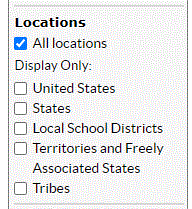
Use the section on the left hand side of the page to filter the data that is displayed in a table. The options displayed in this section may vary depending on the type of information that is displayed in the table. For example, if viewing data for all locations for all years, the system displays the following subsections in the Filter Data section:
- Locations
- Sex
- Race/Ethnicity
- Grade
- Sexual Orientation (Sexual Identity, Sex of Sexual Contacts)
The options under each subsection can be displayed as checkboxes or radio buttons as seen in the examples below.
When options are displayed as checkboxes, you can select one, multiple, or all the options. Options displayed as checkboxes work in a "show/hide" manner. If an option is selected, it displays in the table. For example, if under Locations you select Display all locations, the system displays all the available locations. If you choose to display only States and Territory, the system hides all other locations; the data displayed does not change.
Example of options displayed as checkboxes
Example of options displayed as radio buttons
When options are displayed as radio buttons, you can select one or all the available options. Unlike checkboxes where the system simply shows and hides data, the system recalculates data on a table each time you change the options.
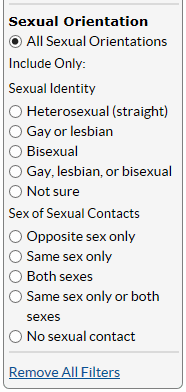
It is important to remember that an option displayed as checkboxes on one table may be displayed as radio buttons on another table.
To clear all the filters you have selected, click the Remove All Filters filters link at the bottom of the Filter Data section.
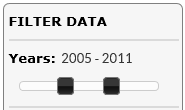
When you select to view data by all years, a slider appears at the top of the Filter Data section to show you the range of years for which data is being displayed. The range of years is represented at the top of the slider. This is the number of years for which data is displayed in the table. In the example below, the range of years represented is 1991-2015.
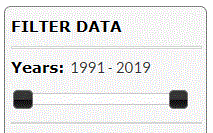
You can use the slider to change the range of years displayed in a table by moving the left or right slider. Move the left slider to change the starting year or move the right slider to change the ending year, as seen in the example below.
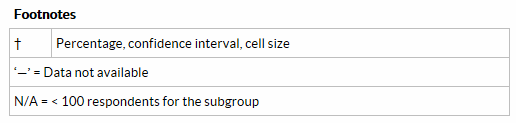
The Footnotes section at the bottom of the page provides more information for the content displayed on the page. The Footnotes section explains the symbols displayed in a table. In the graphic displayed below, the — in a cell in the table indicates that data is not available for that particular entity.
- Viewing and printing a table
- Viewing and printing gata in a graph
- Viewing and printing data in a map
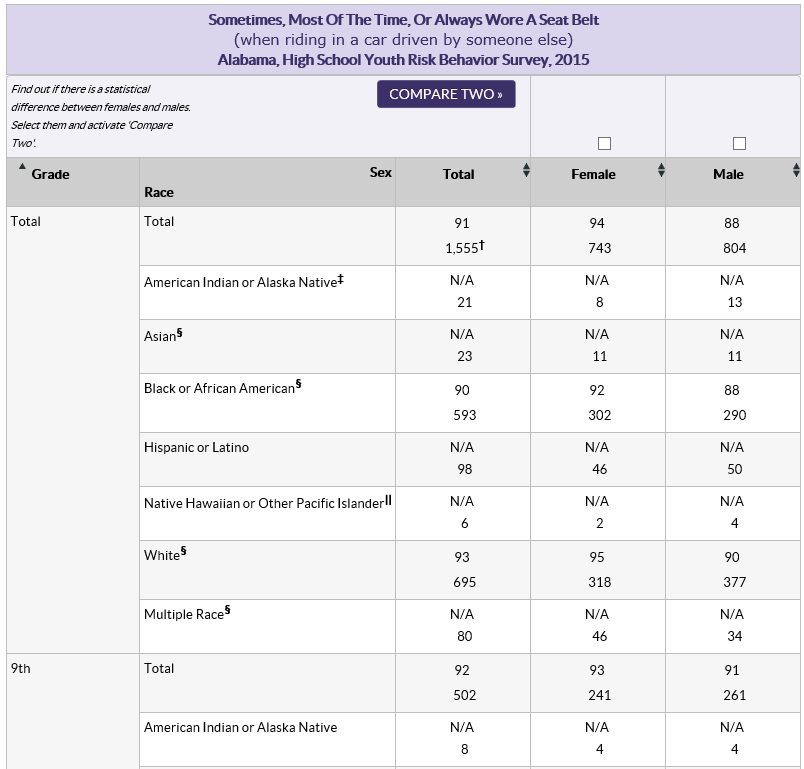
After choosing table content, i.e. Question, Location(s) and Year(s), you can view summary data in table format (default view). To sort the data displayed in a table, simply click on a column heading, e.g. Location, Total, Female, Male, etc.
To print a table:
- While viewing the table you want to print, click the Print
Table link. The system displays a standard Print dialog box.
- Use the
standard Print dialog box to complete the printing process.
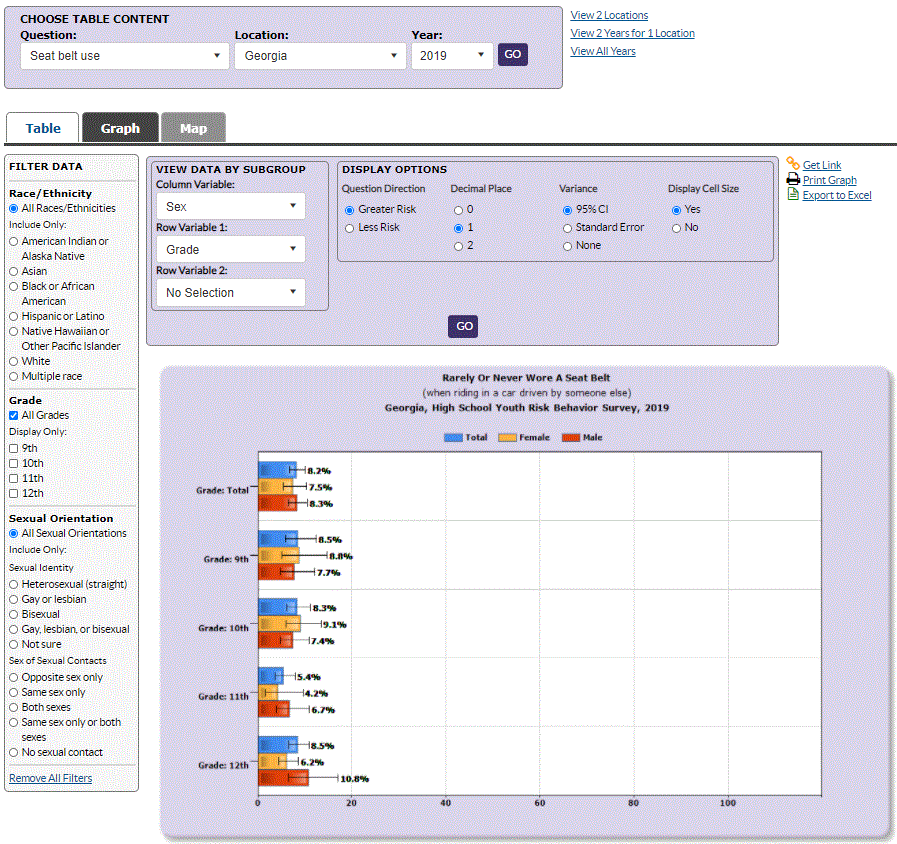
Information presented in a table is also depicted in a graph. To view a graph, click on the Graph tab. The system displays a graphical representation for every response or location displayed in the table. If there are a large number or responses, the page can get rather long so be sure to scroll down the page to view all the graphs on the page. The question is displayed at the top of the graph and the legend explaining information displayed in the graph is displayed under the question. Just as in a table, you can use the options available in Choose Table Content or View Data by Subgroup sections to determine that data displayed in the graph.
To print a graph:
- While viewing the graph(s) you want to print, click the Print Graph link. The system displays a standard Print dialog box.
- Use the standard Print dialog box to complete the printing process.
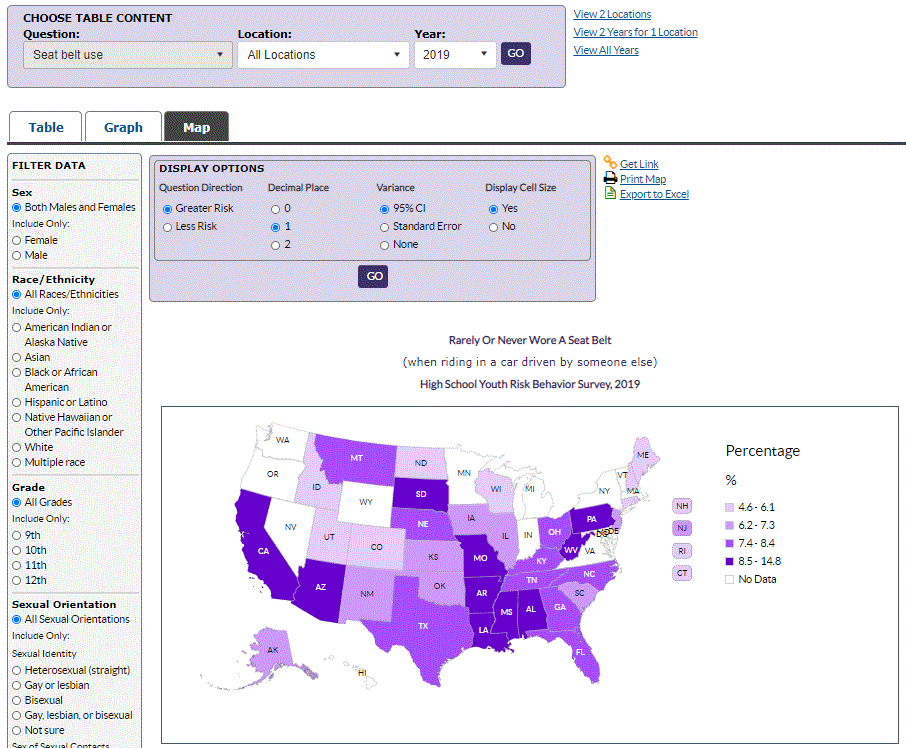
The system displays data in map format only if you select one question, all locations and one year. When data is available in this format, the system enables the Map tab. To view data for a location on the map, hover your cursor above the state. The system displays the percentage, confidence interval, and the cell size for the data point.
To print a map:
- While viewing the map you want to print, click the Print
Map link. The system displays a standard Print dialog box.
- Use the
standard Print dialog box to complete the printing process.
| Top of Page | |