|
Skip Navigation Links
|
|
|
Alcohol-Related Disease Impact (ARDI) - Help
|
|
Using Custom Data
If you have data different from the default data currently included in ARDI, you can create custom data sets for your use in generating ARDI reports. You can use the custom data feature to edit or create data sets, share them with other users or delete them, or use a custom data set to generate a report.
In the ARDI Custom Data section, you can create the following data sets:
Back to
top
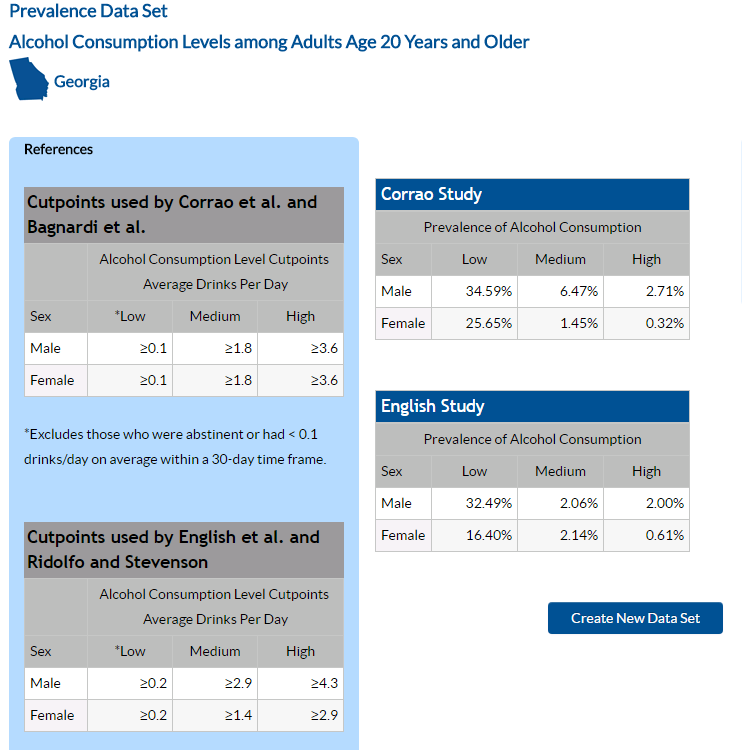
Prevalence of Alcohol Consumption Data Sets
Prevalence data sets are used in the Alcohol-Attributable
Deaths, Years of Potential Life Lost,
and Alcohol-Attributable Fractions reports.
View a prevalence of alcohol consumption data set
- In the View Data Sets section, select the name of the data set to view from the Prevalence of Alcohol Consumption drop down list.
- Click GO.
The following information about the data set is displayed.
- After viewing the data, you can choose to create a new data set or download the data set by clicking on the Download Data Set
link in the Data Set Properties box.
Back to
top
Create a new prevalence of alcohol consumption data set
- In the Generate a Report section under "1. Select data sets”, click the Create New link under Prevalence of Alcohol Consumption. ARDI displays the Create New Data Set page.
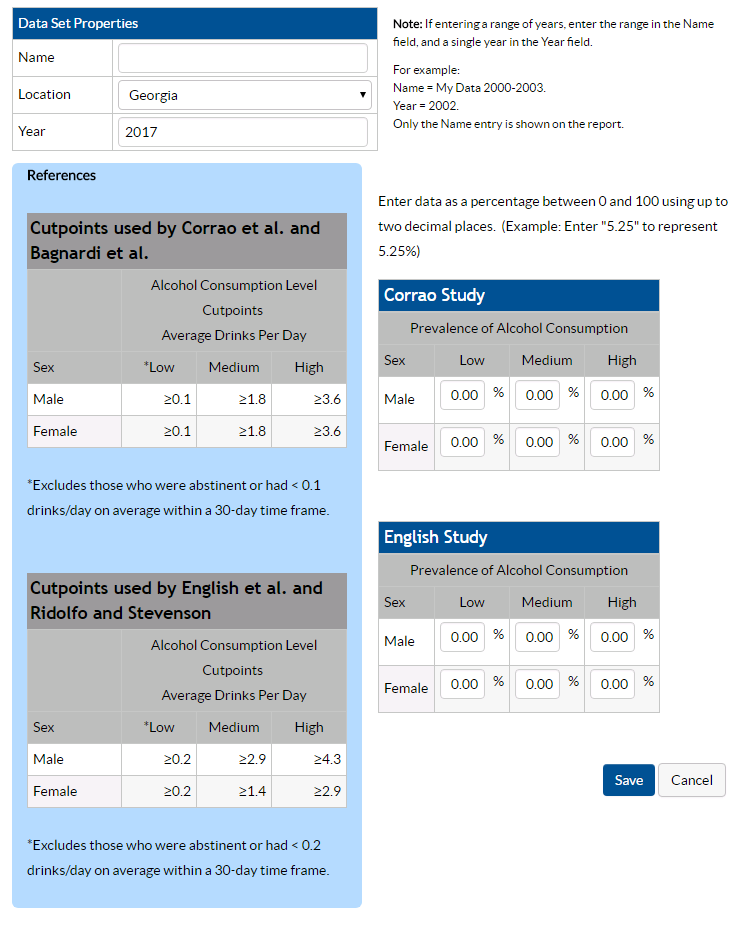
-
In the Name field, enter a name for the custom data set. The
length should be from 5 to 60 characters. If entering a range
of years, enter the range in the Name field. For example: My Data
2000-2003.
-
Choose the location from the drop down menu. The “Year” field is limited so you can only enter a single year. If using multiple years of data, only the first year entered will be captured. To label a report with multiple years, put this information in the “Name” field (see #2).
- Click Save. The Prevalence Data
Set page displays the data you entered.
Once you create a custom Prevalence data set, you can:
Back to
top
Prevalence of alcohol consumption data set field descriptions
Prevalence data set field descriptions are listed in the following table. More information about the cutpoints for alcohol consumption based on studies by Corrao et al. (1999) & Bagnardi et al (2001) and English et al. (1995) & Ridolfo and Stevenson (2001) is provided on the About ARDI - Methods page.
| Field |
Description |
|
Name
|
Name of this data set.
-
If this is a copy of a data set, the name is "Copy of" followed
by the name of the data set you are copying. You can type over
this name to create a new name.
- If this is a new data set, type a name for this data set.
- If entering a range of years, enter the range in the Name field.
For example: My Data 2000-2003.
|
|
Location
|
State or other geographical area where this
data has been collected. Select from the drop-down list.
|
|
Year
|
Year for which this data is relevant. If you
entered a range of years in the Name field, for reference, enter
a single year in the Year field. For example: Name = My Data 2000-2003.
Year = 2002. Only the Name entry is shown on the report.
|
|
Corrao Study-Low
|
Per the Corrao et al. (1999) & Bagnardi et al (2001) studies, percentage of
the selected population that reported low daily alcohol consumption.
|
|
Corrao Study-Medium
|
Per the Corrao et al. (1999) & Bagnardi et al (2001) studies, percentage of
the selected population that reported medium daily alcohol consumption.
|
|
Corrao Study-High
|
Per the Corrao et al. (1999) & Bagnardi et al (2001) studies, percentage of
the selected population that reported high daily alcohol consumption.
|
|
English Study-Low
|
Per the English et al. (1995) & Ridolfo and Stevenson (2001) studies, percentage of
the selected population that reported low daily alcohol consumption.
|
|
English Study-Medium
|
Per the English et al. (1995) & Ridolfo and Stevenson (2001) studies, percentage of
the selected population that reported medium daily alcohol consumption.
|
|
English Study-High
|
Per the English et al. (1995) & Ridolfo and Stevenson (2001) studies, percentage of
the selected population that reported high daily alcohol consumption.
|
Back to
top
Relative Risks and Alcohol-Attributable Fractions (AAF) Data Sets
Relative Risks and AAF data sets are used in the Alcohol-Attributable
Deaths, Years of Potential Life Lost,
and Alcohol-Attributable Fractions reports.
Note: You can create copies of AAF but not
of relative risks. Also, AAF are a subset of all the causes in the
system and you can edit only those causes specifically designated
as user-editable. Only the user-editable causes are displayed when you
edit the data set.
View a relative risks and direct alcohol-attributable fractions data set:
-
- Click GO. The following information about the data set is displayed.
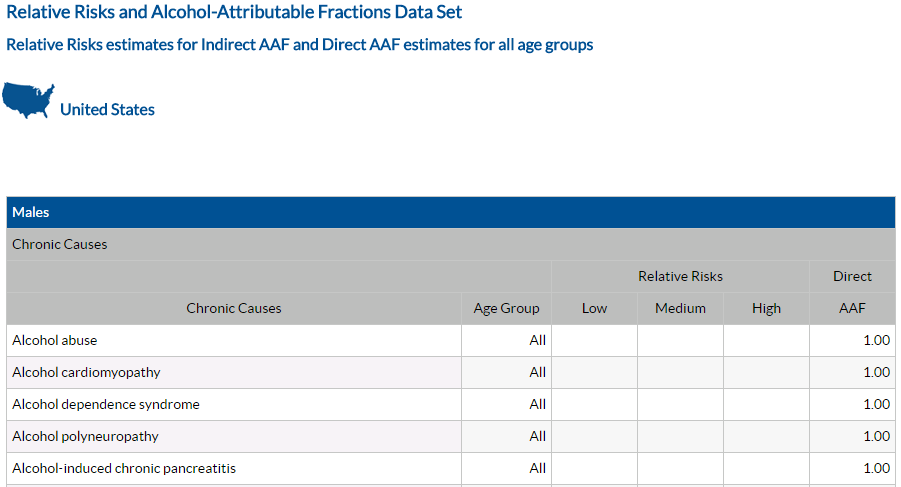
- After viewing the data, you can choose to create a new data set or download the data set by clicking on the Download Data Set
link in the Data Set Properties box.
Back to
top
Create a new direct alcohol-attributable fractions data set
To create an editable copy of an AAF data set:
- In the Generate a Report section under 1. “Select data sets”, click the Create New link under
ARDI displays the Create New Data Set page.
Note: The text "Copy of" precedes the name of the data set being copied.
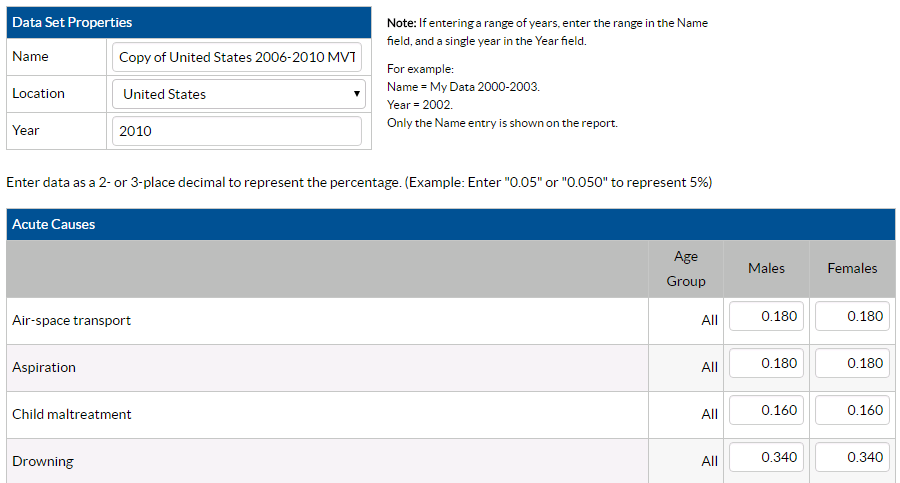
-
In the Name field, enter a name for the custom data. The length
should be from 5 to 60 characters. If entering a range of
years, enter the range in the Name field. For example: My Data 2007-2009.
-
Choose the location from the drop down menu. The “Year” field is limited so you can only enter a single year. If using multiple years of data, only the first year entered will be captured. To label a report with multiple years, put this information in the “Name” field (see #2).
- Click Save. The AAF Data Set page
displays the data you entered.
Once you create a custom data set, you can:
Back to
top
Direct alcohol-attributable fraction data set field descriptions
AAF data set field descriptions are
listed in the following table.
| Field |
Description |
|
Name
|
Name of this data set.
- If this is a copy of a data set, the name is "Copy of" followed by the name of the data set you are copying. You can type over this name to create a new name.
- If this is a new data set, type a name for this data set.
- If entering a range of years, enter the range in the Name field. For example: My Data 2000-2003.
|
|
Location
|
State or other geographical area where this
data has been collected. Select from the drop-down list.
|
|
Year
|
Year for which this data is relevant. If you
entered a range of years in the Name field, for reference, enter
a single year in the Year field. For example: Name = My Data 2000-2003.
Year = 2002. Only the Name entry is shown on the report.
|
|
Age Group Males
|
AAF or proportion of males that died from this cause of death for all ages, except motor-vehicle traffic crashes which uses an age-specific AAF. Percentages are expressed as two-place decimal numbers.
|
|
Age Group Females
|
AAF or proportion of females that died from this cause of death for all ages, except motor-vehicle traffic crashes which uses an age-specific AAF. Percentages are expressed as two-place decimal numbers.
|
Back to
top
Total Deaths Data Set
Total Deaths data sets are used in the Alcohol-Attributable
Deaths and Years of Potential Life
Lost reports.
View a total deaths data set
- In the View Data Sets section, select the name of the data set to view from the Total Deaths drop down list.
helpimages/shared_data_set.png
- Click GO. The system displays the selected data set.
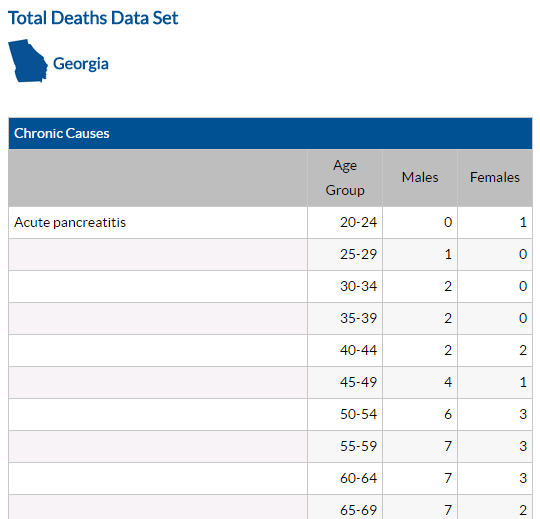
- After viewing the data, you can choose to upload a new data set or download the data set by clicking on the Download Data Set link the Data Set Properties box.
Back to
top
Upload total deaths data from a SAS xml file:
- In the Generate a Report section under "1. Select data sets”, click the Upload Data link under Total Deaths. ARDI displays the Upload Total Deaths Data (SAS) .XML page (default.)
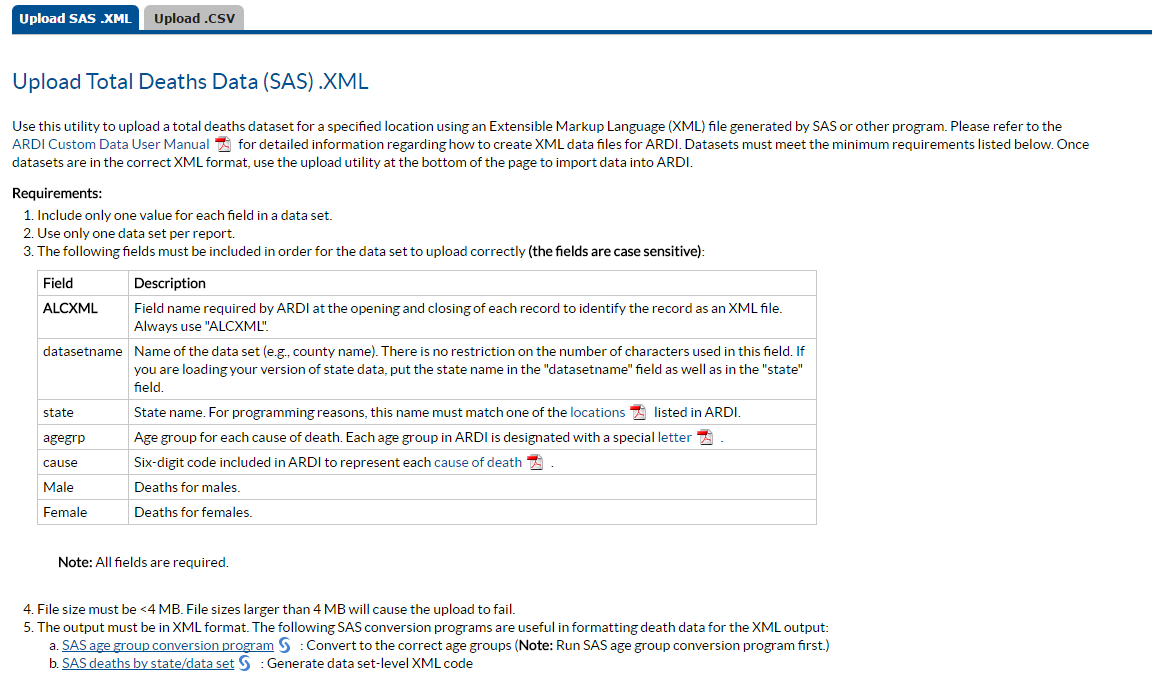
- Read the requirements to understand how to format your data set.
- Name the XML data set file using the following guide:
- In the Enter Year field, enter one four-digit year for the data set.
- In the Select SAS XML File field, click Browse, select the file that you want to upload on the Choose File dialog box, and then click Open. The path and file you selected is displayed in the field next to the Browse button.
- After selecting the file, click the Upload button to upload the data. If the upload is successful, the Custom Data home page will include the new data set in the Total Deaths Data Sets list.
Once you create a custom Total Deaths data set you can:
Back to
top
SAS XML total deaths data set field descriptions
Total Deaths field descriptions for the SAS XML upload are listed in the following table.
| Field |
Description |
|
alcxml
|
Field name required by ARDI at the opening and closing of each record to identify the record as an XML file. Always use "alcxml".
|
|
datasetname
|
Name of the data set (e.g., county name). There is no restriction on the number of characters used in this field. If you are loading
your version of state data, put the state name in the "datasetname" field as well as in the "state" field.
|
|
state
|
State name. For programming reasons, this name must match one of the locations listed in ARDI.
|
|
agegrp
|
Age group for each cause of death. Each age group in ARDI is designated with a special letter.
|
|
cause
|
Six-digit code included in ARDI to represent each cause of death.
|
|
male
|
Deaths for males.
|
|
female
|
Deaths for females.
|
Upload total deaths data from a comma-separated value (.csv) file:
- In the Generate a Report section under "1. Select data sets”, click the Upload Data link under Total Deaths. ARDI displays the default Upload Total Deaths Data (SAS) .XML page.
- Click the Upload .CSV tab. ARDI displays the Upload Total Deaths Data (.CSV) page. Read the introduction to understand how to format your data set.
- Name the CSV file using the following guide:
- Complete the fields in the “Select a CSV Data File” section at the bottom of the page as follows:
- Click Browse, select the file that you want to upload on the Choose File dialog box, and then click Open. The path and file you selected is displayed in the field next to the Browse button.
- In the Name field, enter the of the data set. If entering a range of years, enter the range in the Name field. For example: My Data 2000-2003.
- In the Location field, select the state or other geographical area where the data has been collected from the drop-down list.
- In the year field, enter a single year to assign to the data. This year will not be printed on the reports generated with this data set.
- Click Upload. If the upload is successful, the Custom Data home page will include the new data set in the Total Deaths Data Sets list.
Once you create a custom Total Deaths data set you can:
Comma-separated value (.csv) total deaths data set field descriptions
Total Deaths field descriptions for the .csv upload are listed in the following table.
| Field |
Description |
|
cause of death abbreviation
|
Six-digit code included in ARDI to represent each cause of death.
|
|
age group
|
Age group for each cause of death. Each age group in ARDI is designated with a special letter.
|
|
male deaths
|
Deaths for males.
|
|
female deaths
|
Deaths for males.
|
Back to
top
Editing a Data Set
Note: This option is available only for data sets
that you have created or have access to edit.
To edit a data set:
- In the View Data Sets section, select the data set to be edited from the
drop down list.
- Click GO. ARDI displays the selected data set.
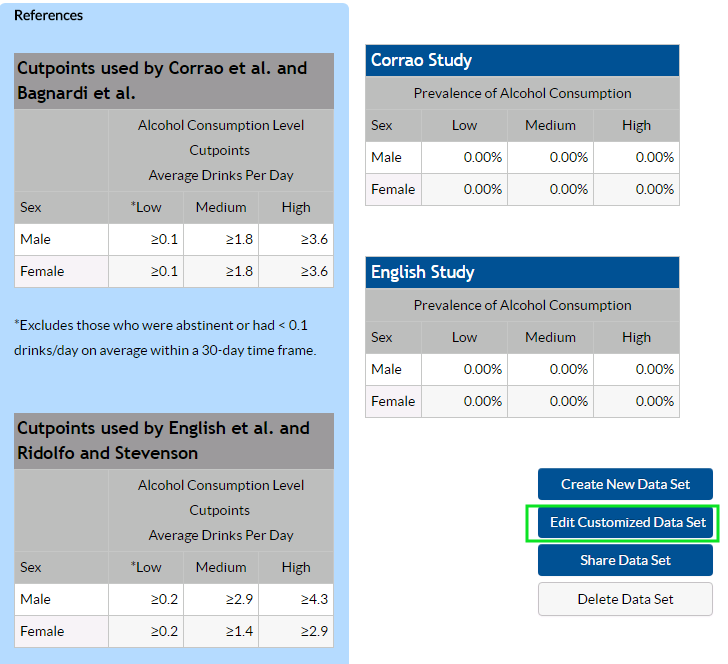
- Click Edit Customized Data Set. ARDI displays the data set in editable format.
- Change the data in the fields as needed:
- Click Save. ARDI saves the changes made to the data set and re-displays the View page,
where you can review your edits.
Back to
top
Sharing Data with Other Users
Note: This option is available only for data sets that
you created or have access to share.
- In the View Data Sets section, select the data set to be edited from the
drop down list.
- Click GO. ARDI displays the selected data set.
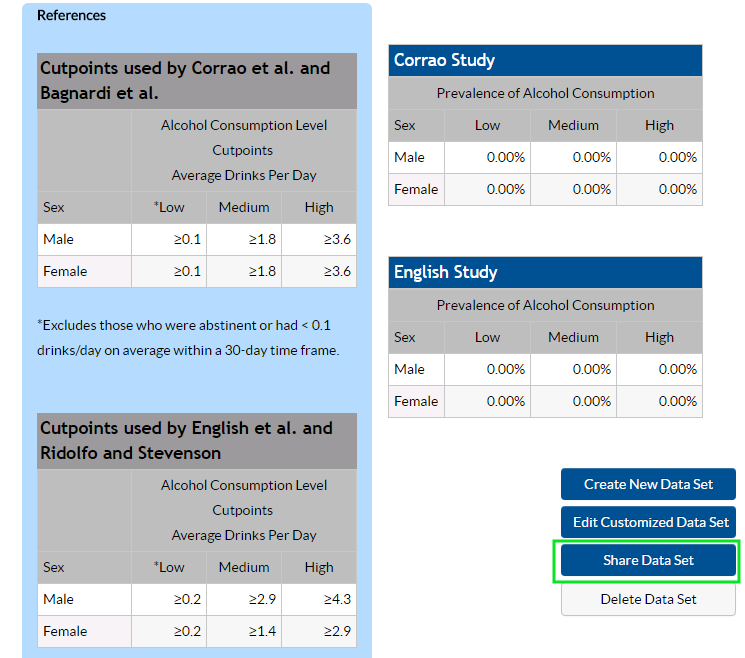
- Click Share Data Set. ARDI displays the Share Data Set page.
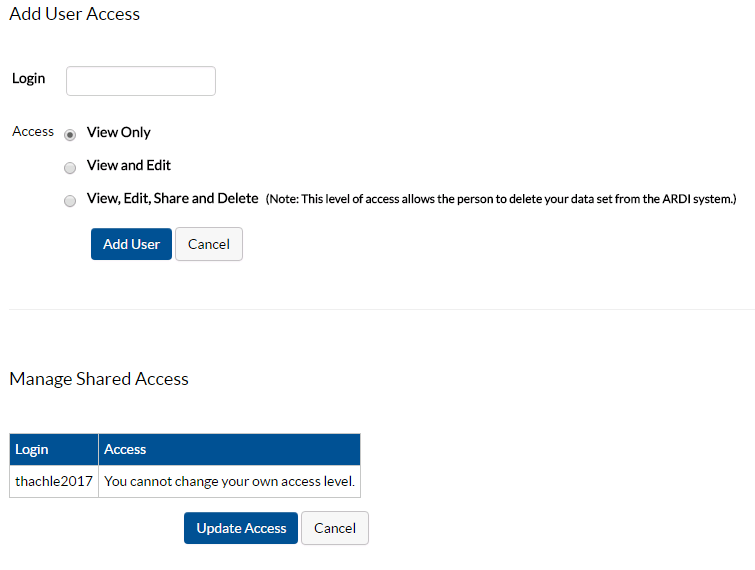
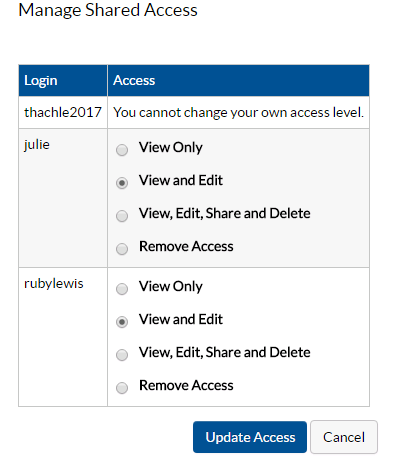
-
Type the user's ARDI login ID in the "Login" field under the
Add User Access header.
- Select the level of access this user should have to the data set.
-
View Only allows the user to only view the data set you are sharing,
but not edit, share, or delete it.
-
View and Edit allows the user to only view and edit the data
set you are sharing.
- View, Edit, Share, and Delete allows the user to perform all
of these functions for the data set you are sharing.
- Click Add User. ARDI displays a success message, the user you added, and the access level
you selected in the table under the Maintain User
Access section. From this table, you can select a different access level
or remove this user by clicking Remove Access.
Back to
top
Deleting a Data Set
Note: This option is available only for data sets
that you have created or have access to delete.
To delete a data set, on the Use Custom Data page:
- In the View Data Sets section, select the data set to be deleted from the
drop down list.
- Click Go. ARDI displays the data set page.
- Click Delete Data Set. ARDI displays a confirmation message.
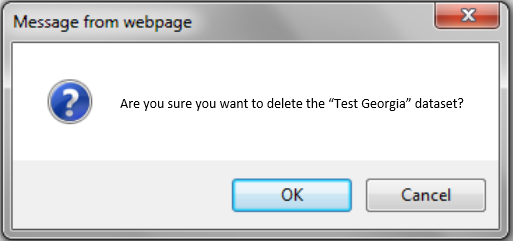
- To delete, click OK. ARDI deletes the data set and displays a confirmation message on the ARDI Custom
Data page.
Back to
top
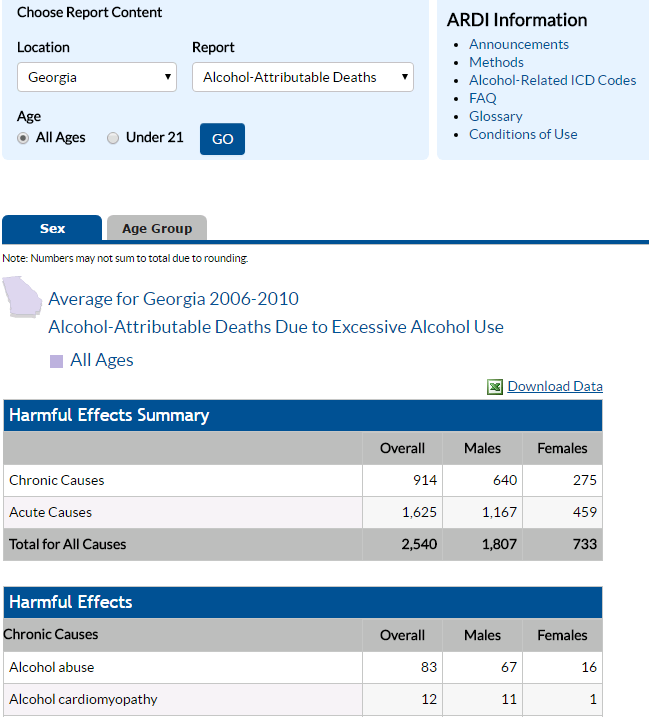
Generating a Report
To generate a report on the ARDI Custom Data page:
-
In the Generate a Report section, select the data sets you want to use for the report under "1 Select
Data Sets".
- Select the report you want to generate under "2 Show a Report For". You can select either
or
.
- Click GO. ARDI displays the selected report. From the report page
you can display the data sets used to generate this report, change the
report view, or print or download a
report or data set.
Back to
top
|

